Committer Benchmark
This screen allows the tracking of vulnerabilities created by each developer within a selected period, with closed vulnerabilities being excluded from this view. The score found on the rightmost side of each committer row is computed in a manner similar to the risk score.
The table and labels can be filtered by projects, teams, and committers using the search box in the top row, highlighted in light blue. Additionally, sorting by the committer and score is possible. The default date range is set to the last 30 days but can be altered using the date picker located in the same row.
It is possible to click on the number of vulnerabilities in each severity category in each row to view a list of the vulnerabilities falling under that category.
The export button helps users to get a list of all vulnerabilities that are displayed in the table in a CSV format.
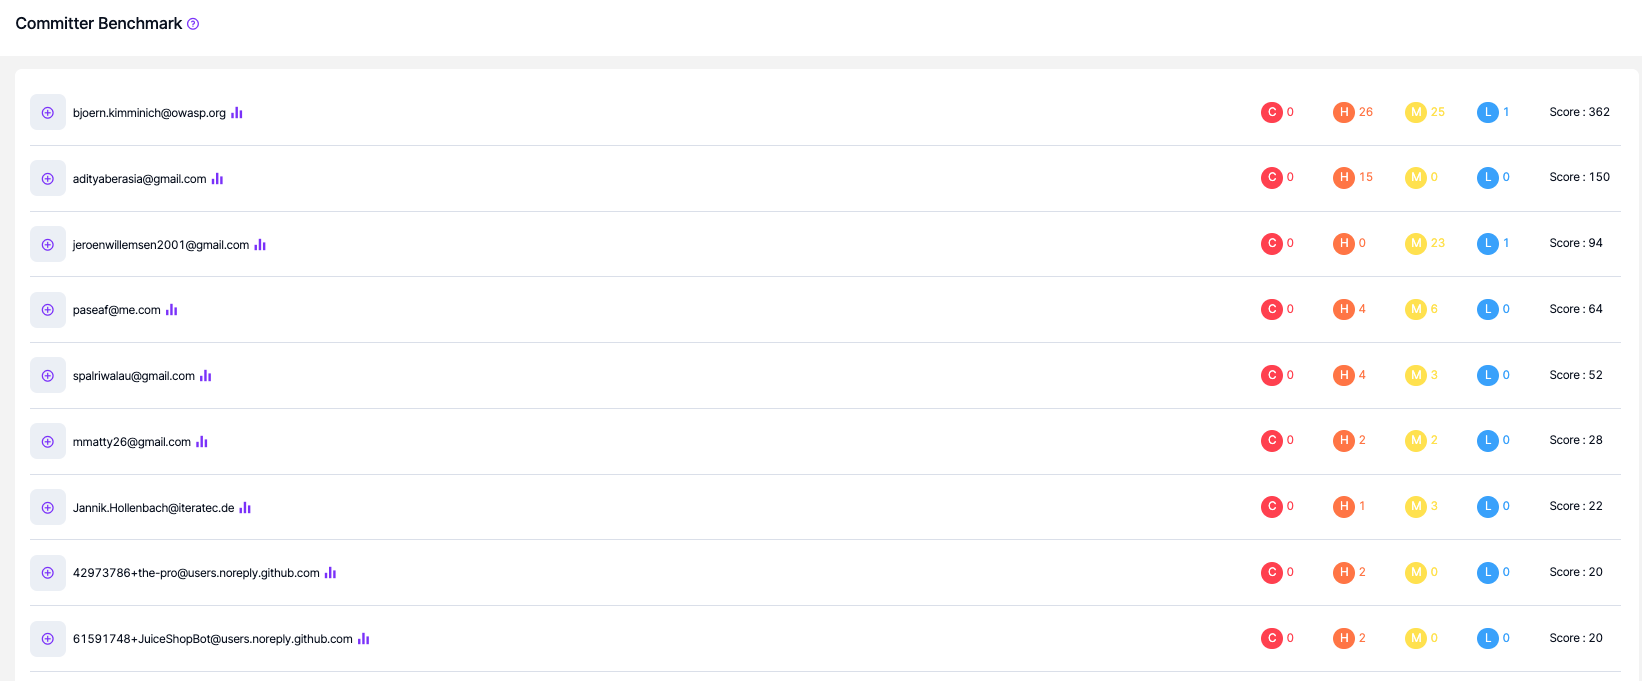
The distribution of vulnerabilities created by a specific developer, categorized based on CWE Name and OWASP Top-10 categories, along with the programming language information, can be viewed by clicking on the chart icon next to each committer.
If an e-learning platform has been activated under the Training section in Integrations, the logo of the e-learning platform appears in the top right corner to assign the relevant course to the developer directly from the Kondukto UI.
When a user is already registered to the e-learning platform with the same email address, the "Assign Training" button becomes clickable, enabling the assignment of courses to developers within the same window.
Updated about 1 year ago