Dashboard at a Glance
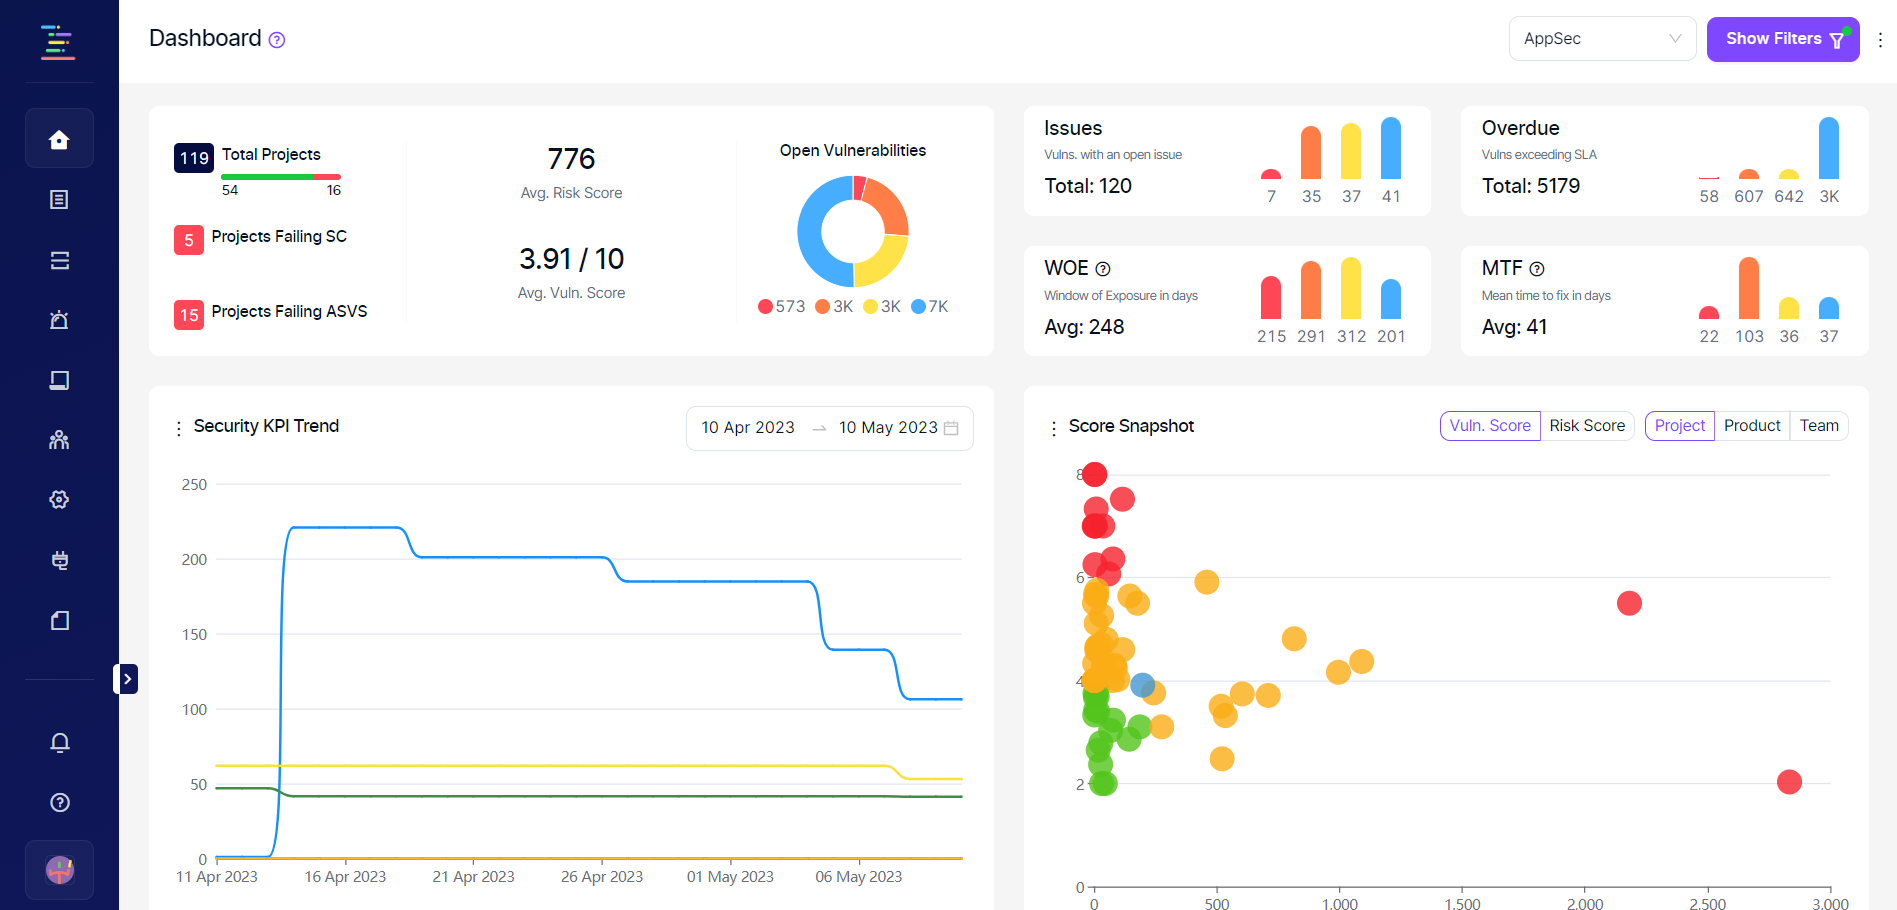
The organizational dashboard on the side navigation menu displays the overall situation of all projects and all vulnerabilities discovered in projects.
AppSec and Infra metrics are displayed separately, and the view can be changed using the drop-down menu next to the filter button.
It is possible to filter out the data by selecting specific projects, products, business units, teams, or labels from the filter button in the upper right corner. Team leads, and users can filter only by the projects their teams are assigned to.
Updated about 1 year ago
Did this page help you?