Jump to Content
KonduktoBlogOpen a Ticket
GuidesRecipesAPI ReferenceChangelog
v2.0

BlogOpen a TicketKondukto
v2.0GuidesRecipesAPI ReferenceChangelog

Getting Started

  • Server Host Requirements
  • Installation/Upgrade
  • Overview of Architecture
  • User Permission Matrix
  • FAQs

Dashboard

  • Dashboard at a Glance
  • Description of Cards
  • Metrics

Projects & Products

  • Projects List
  • Project Settings
    • Info
    • Source Control
    • Scanners
    • Issue Assignment
    • Security Criteria
    • Alerts
  • Project Dashboard
  • Project Scans
  • Project Vulnerabilities
    • Infrastructure Vulnerabilities
    • Adding Vulnerabilities Manually
    • AppSec Vulnerabilities
    • Threat Intelligence
  • Project Files
  • Project Imports
  • Project Images
  • Products
  • Project Mgmt.
  • ASVS

Scans

  • Scans Page
  • Scans Queue
  • Completed Scans
  • Failed Scans
  • Scans Calendar
  • Imports

Vulnerabilities

  • Vulnerability DB
  • Committer Benchmark

SBOM

  • Scans
  • Components

Users

  • Teams
  • Users
  • Shadow User

Automation

  • Setup
    • Labels
    • Business Units
    • Business Criticality Thresholds
    • SLA Rules
    • Severity Score
    • Global Settings
    • Infra Profiles
  • Workflows
    • Alerts Rules
    • Security Criteria
    • Issue Criteria
    • Suppression Rules
    • Remediation Database
    • Reports

Integrations

  • Overview of Integrations
  • Kondukto Scan Agent (KONDA)
  • Integrating with Webhooks

Logs

  • Logs

advanced configurations

  • SSL Certificate Installation

Integration Manuals

  • Azure Active Directory Integration
  • Github Enterprise Integration
  • Jira Integration
  • Bitbucket Integration
  • Okta Integration
  • Google SSO Integration
Powered by 

Logs

Suggest Edits

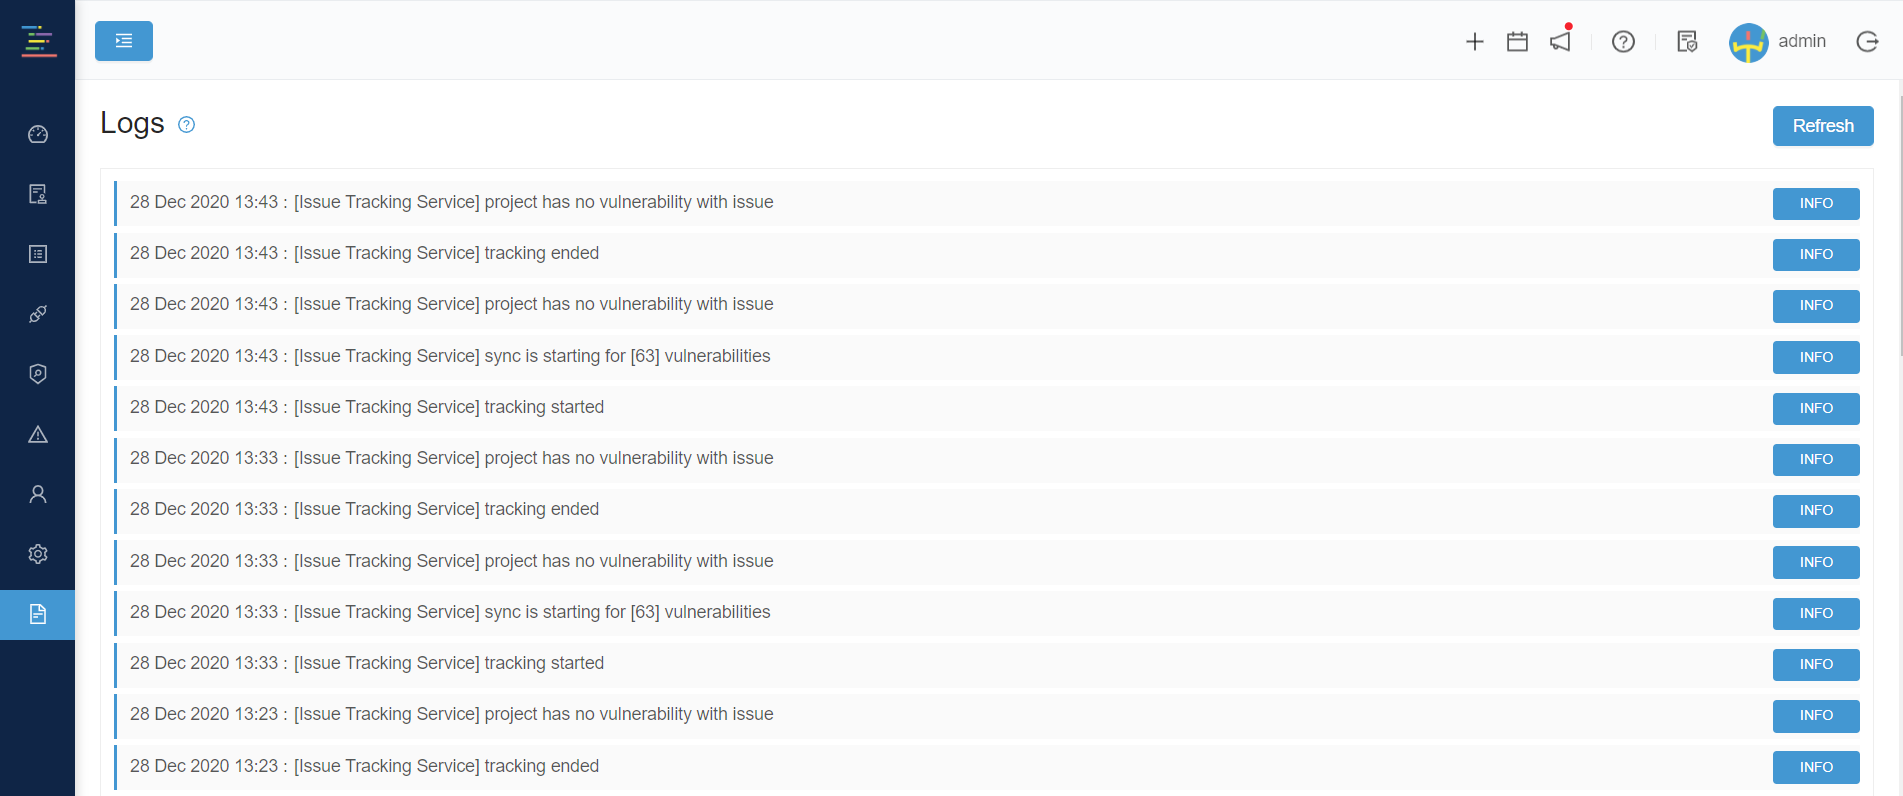
Three types of messages are shown in the Logs section; Debug, Error, and Info.

Only the last 50 logs are displayed on the interface.

You can refresh logs by clicking on the Refresh button in the upper right corner.
1903

Updated about 1 year ago