Webhook integration with audit log events
Capturing Audit Log Events
Introduction
Invicti ASPM provides webhook support to notify external systems about important events occurring on the platform. With this feature, you can transmit audit log records created in Invicti ASPM to your own applications or third-party services in real-time.
This article examines the webhook setup, HTTP header configuration, and audit log event capturing process in Invicti ASPM step by step.
What is a Webhook?
A webhook is a mechanism that automatically sends an HTTP POST request to another URL when a specific event occurs in an application. Invicti ASPM webhooks send data in JSON format to your specified endpoint when an audit log record is created on the platform.
Set up a webhook integration
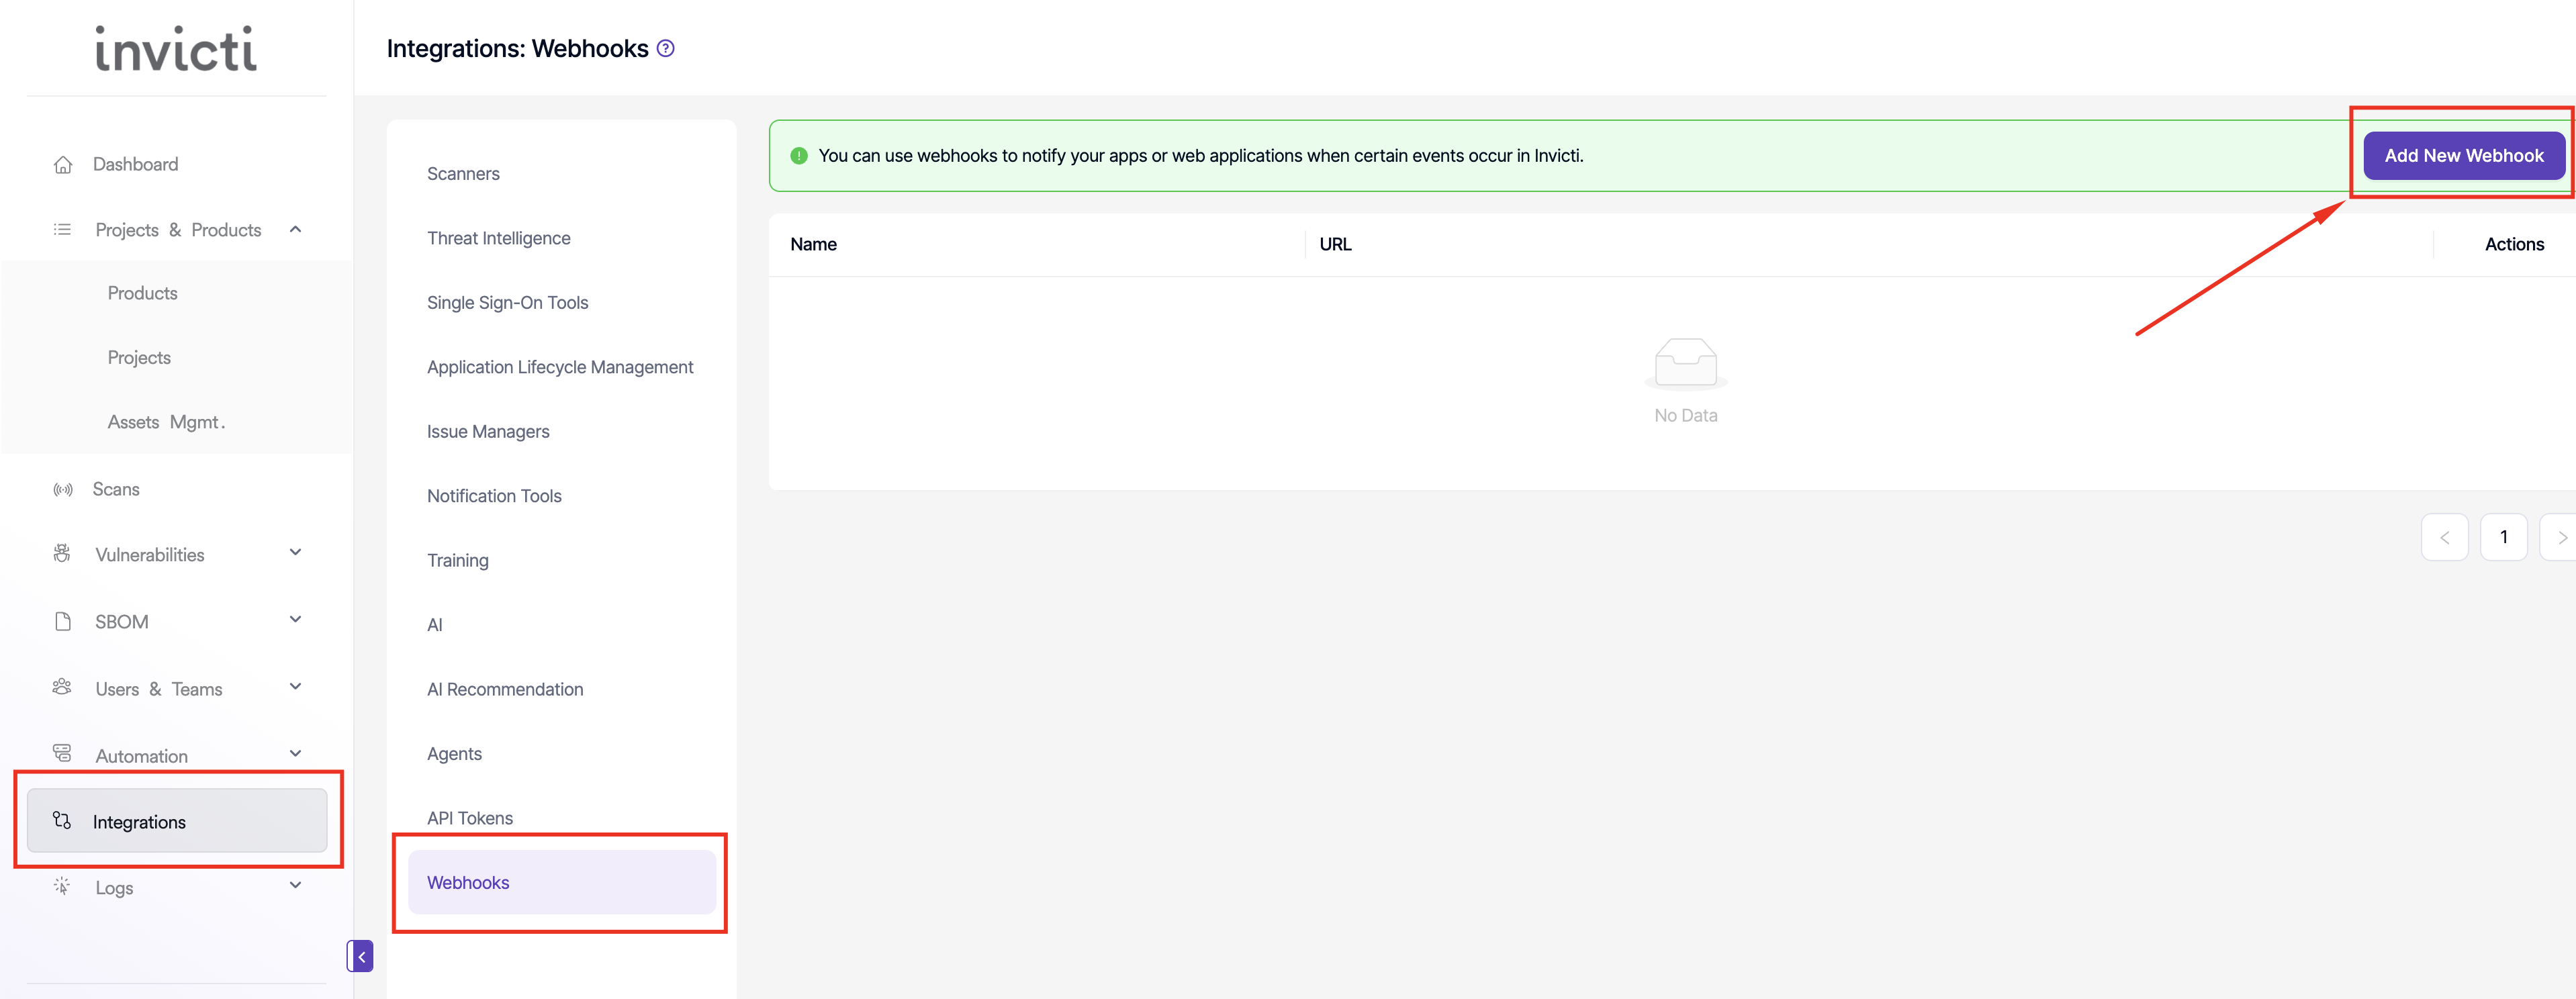
Step 1: Accessing the Webhook Page
First, navigate to the webhook management page in the Invicti ASPM interface:
Select Integrations from the left-side menu, then select Webhooks
On the webhook page, you can view your existing webhooks and add new ones. At the top of the page, there's a green informational message: "You can use webhooks to notify your apps or web applications when certain events occur in Invicti."
To create a new webhook, click the Add New Webhook button in the upper right corner.
Step 2: Configure basic information
When you click the Add New Webhook button, a modal window opens. This window contains fields where you need to configure your webhook:
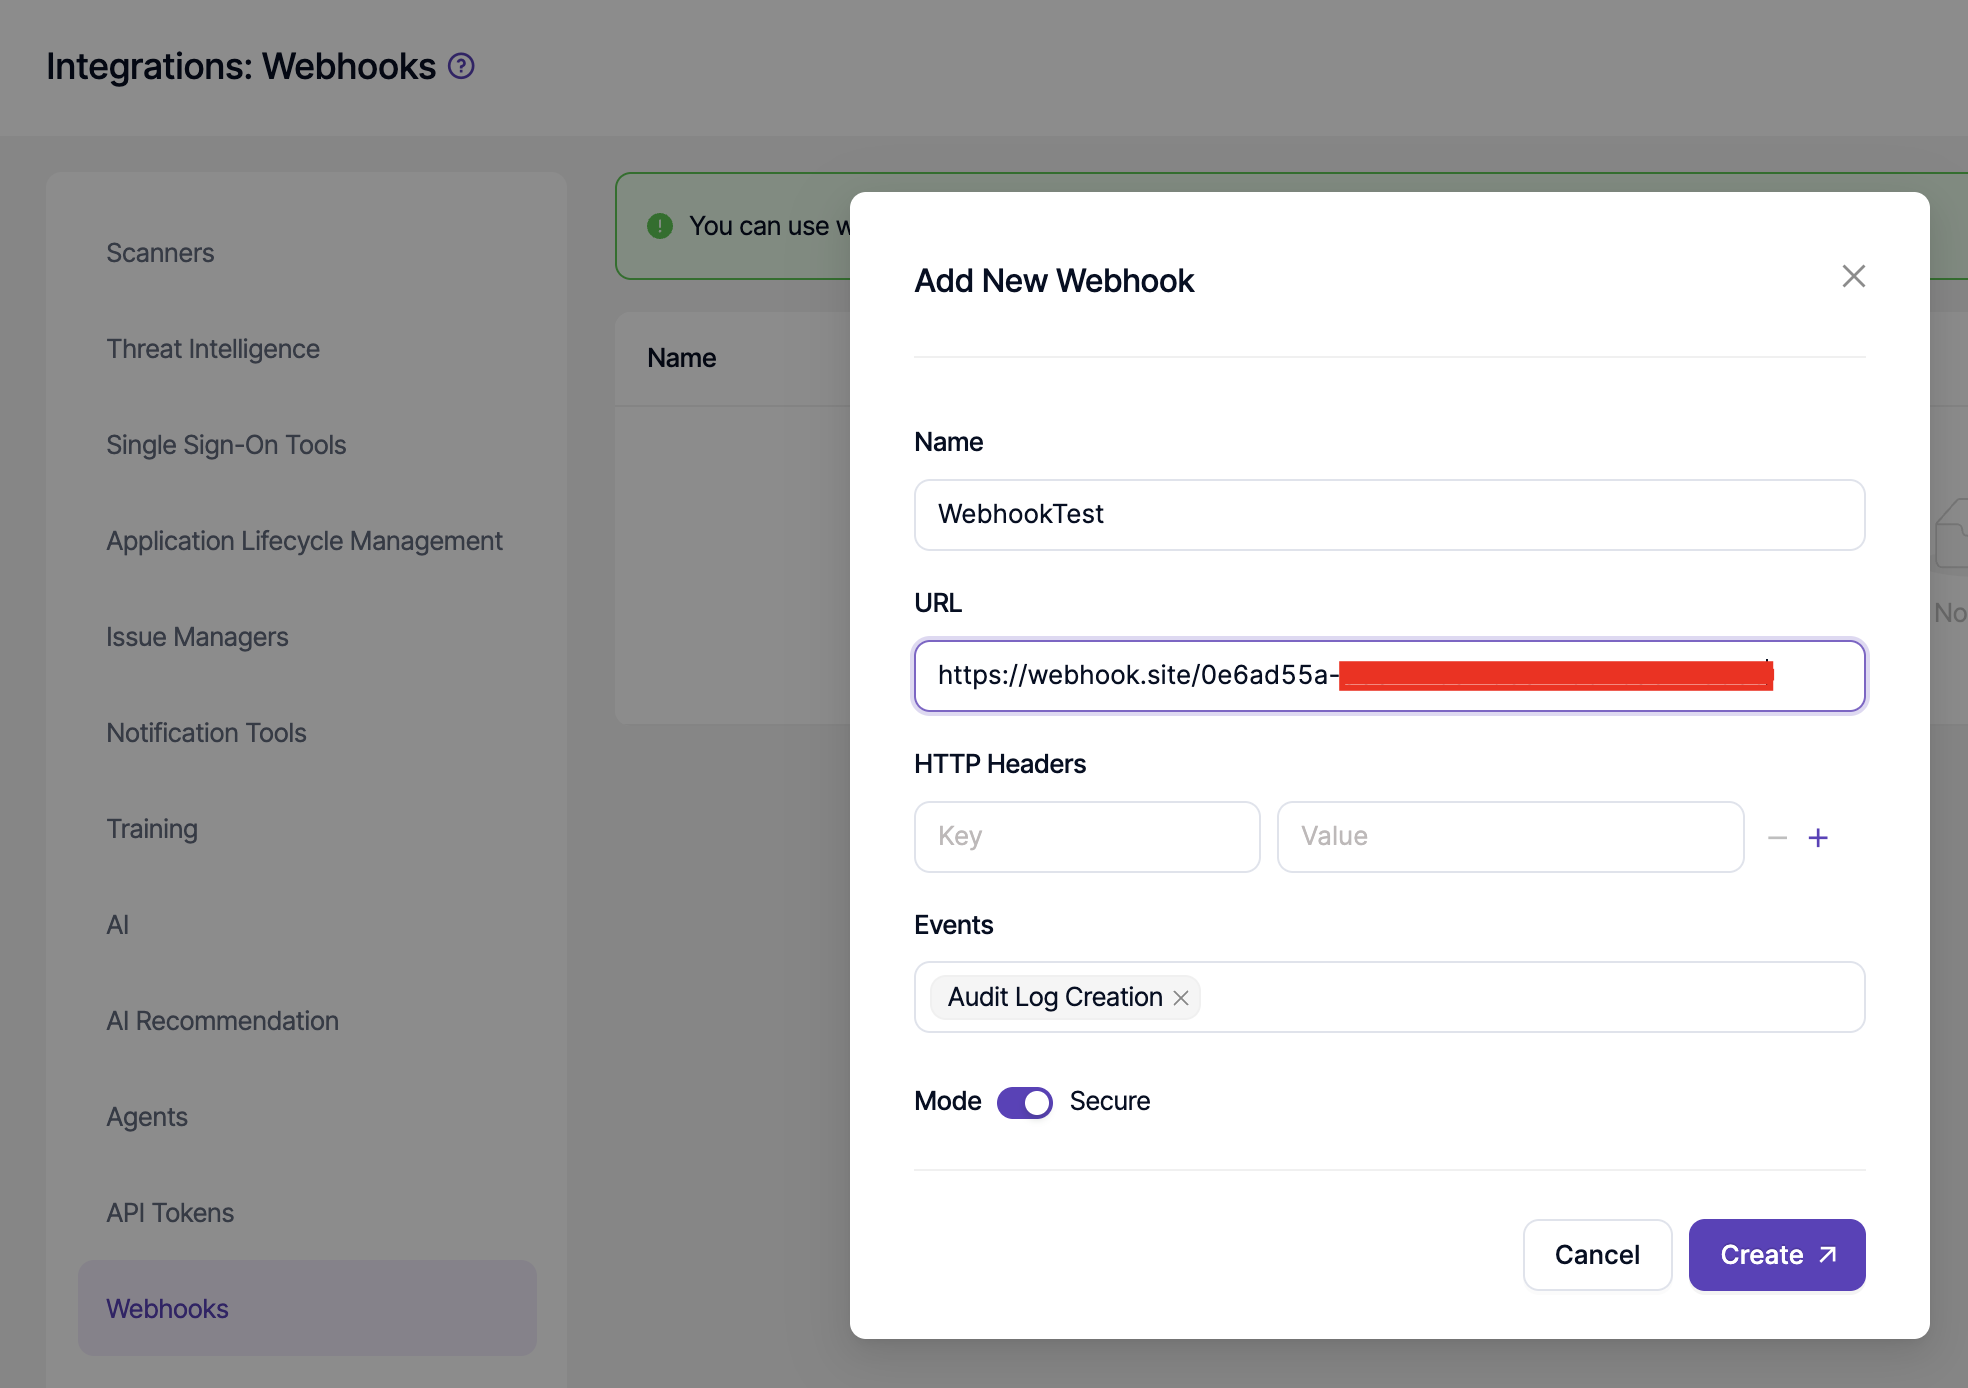
This window contains fields where you need to configure your webhook:
Webhook Name
Give your webhook a descriptive name. In the image, the example "WebhookTest" is used. This name will be used to manage and distinguish the webhook later.
Webhook URL
Enter the target URL where Kondukto will send events. This can be an endpoint on your own server or a URL from testing tools like webhook.site.
In Image 2, you can see the URL field partially filled:
https://webhook.site/0e6ad55a-...HTTP Headers
You can add custom HTTP headers to webhook requests. In Image 2, we see the headers not yet added (Key and Value fields are empty).
Events
In Image 2, we see that the "Audit Log Creation" event is selected. This determines when the webhook will be triggered.
Mode
In Image 2, the toggle switch shows that "Secure" mode is active.
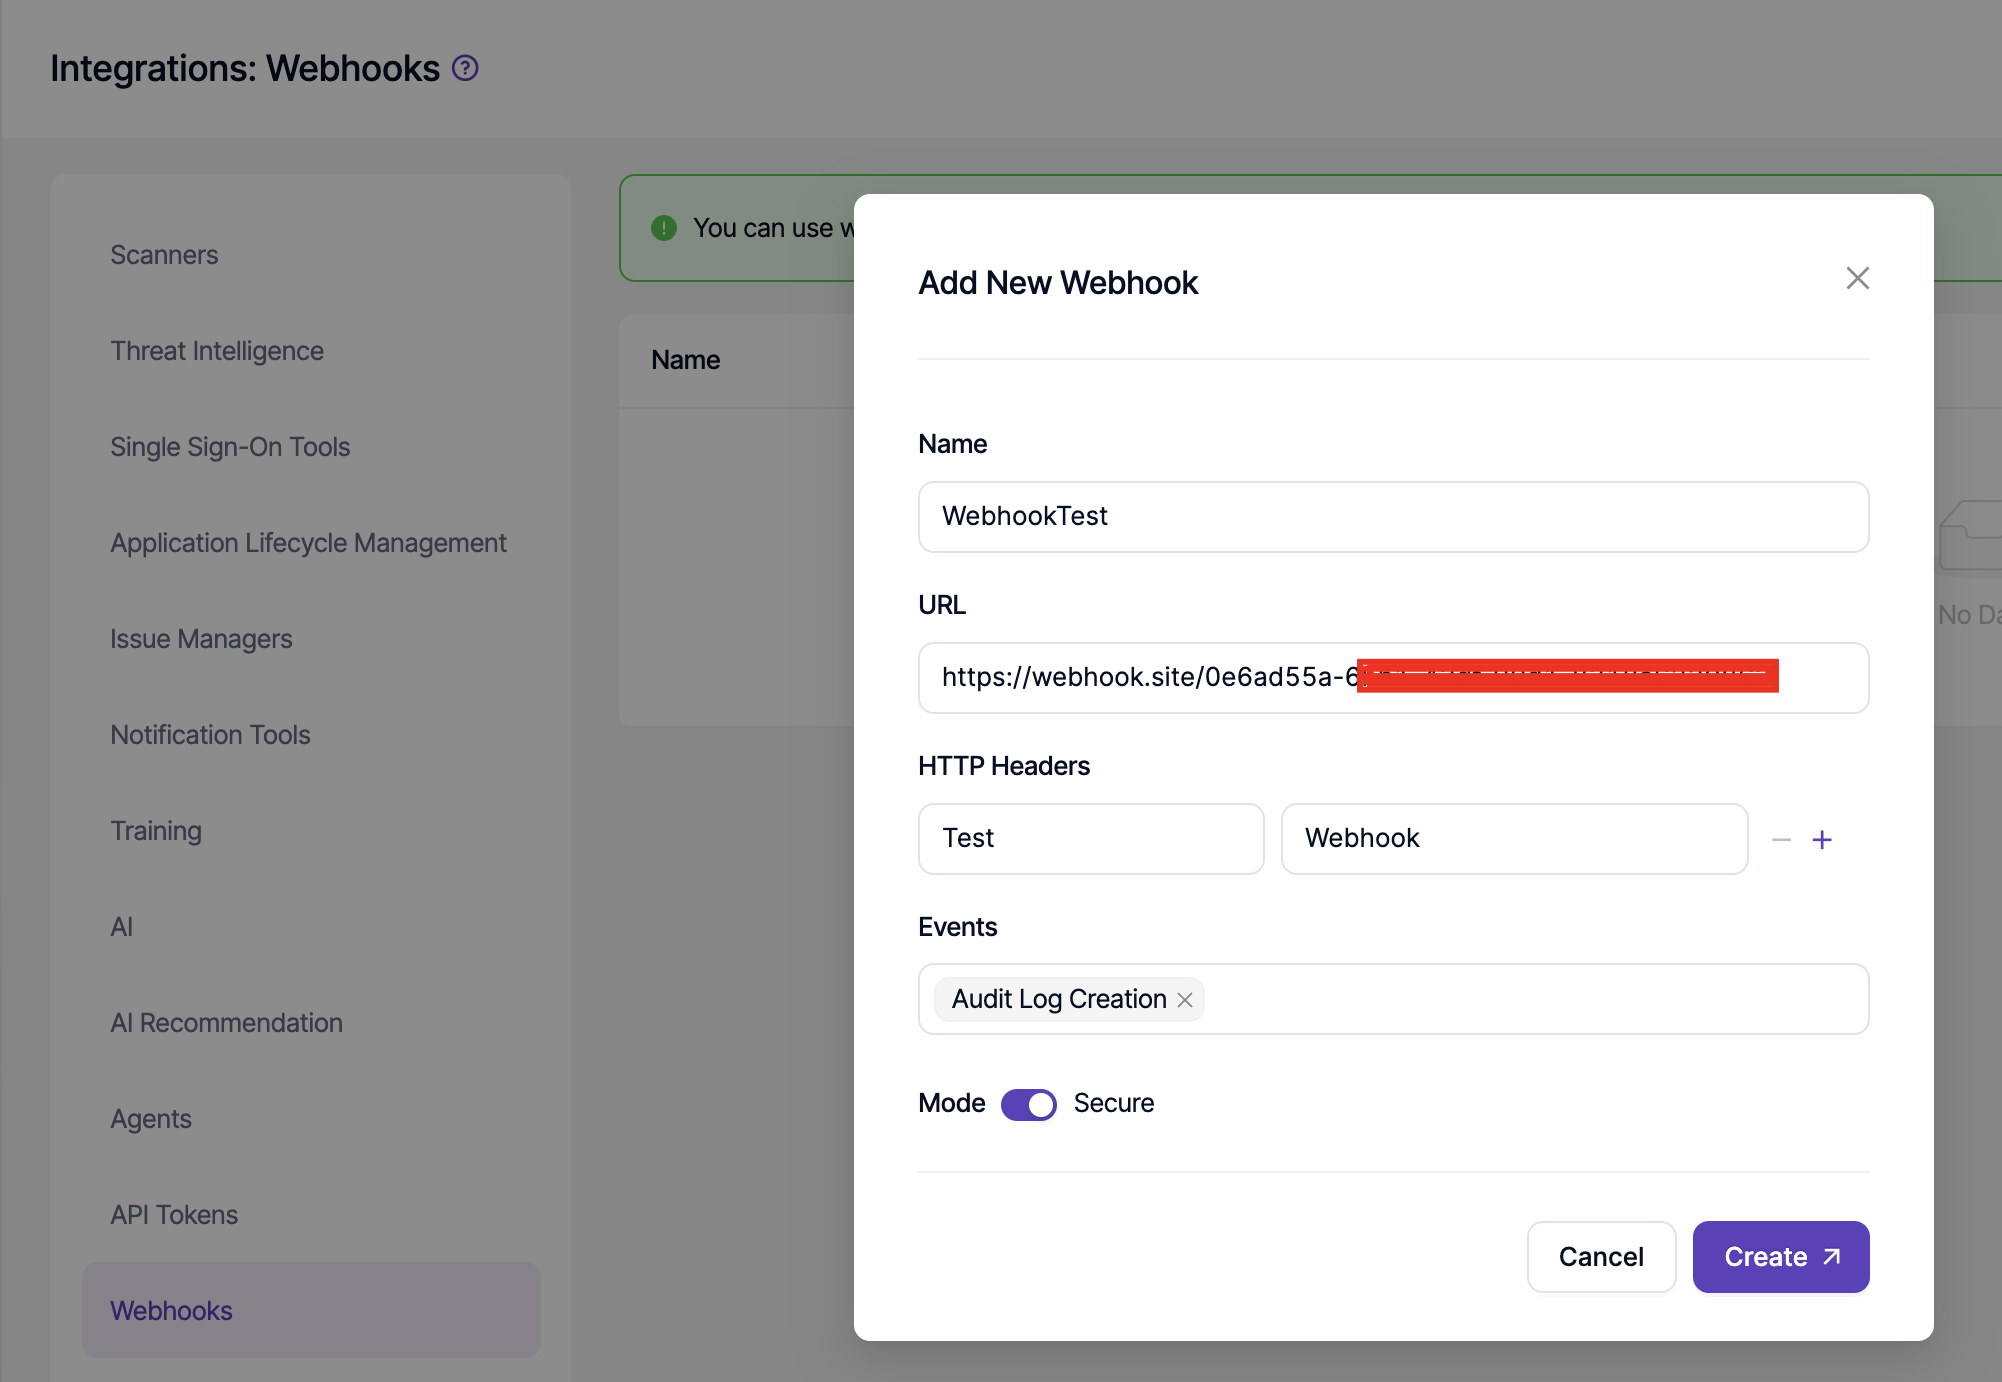
Step 3: Add HTTP headers
To add custom HTTP headers:
- Enter the header name in the Key field (for example, "Test")
- Enter the header value in the Value field (for example, "Webhook")
- Use the + button to add multiple headers
- Use the - button to remove a header
After filling in all fields, click the Create button at the bottom of the modal window to save the webhook.
Step 4: View the Webhook list
After the webhook is successfully created, it's displayed in a table on the main webhook page. The table contains the following information:
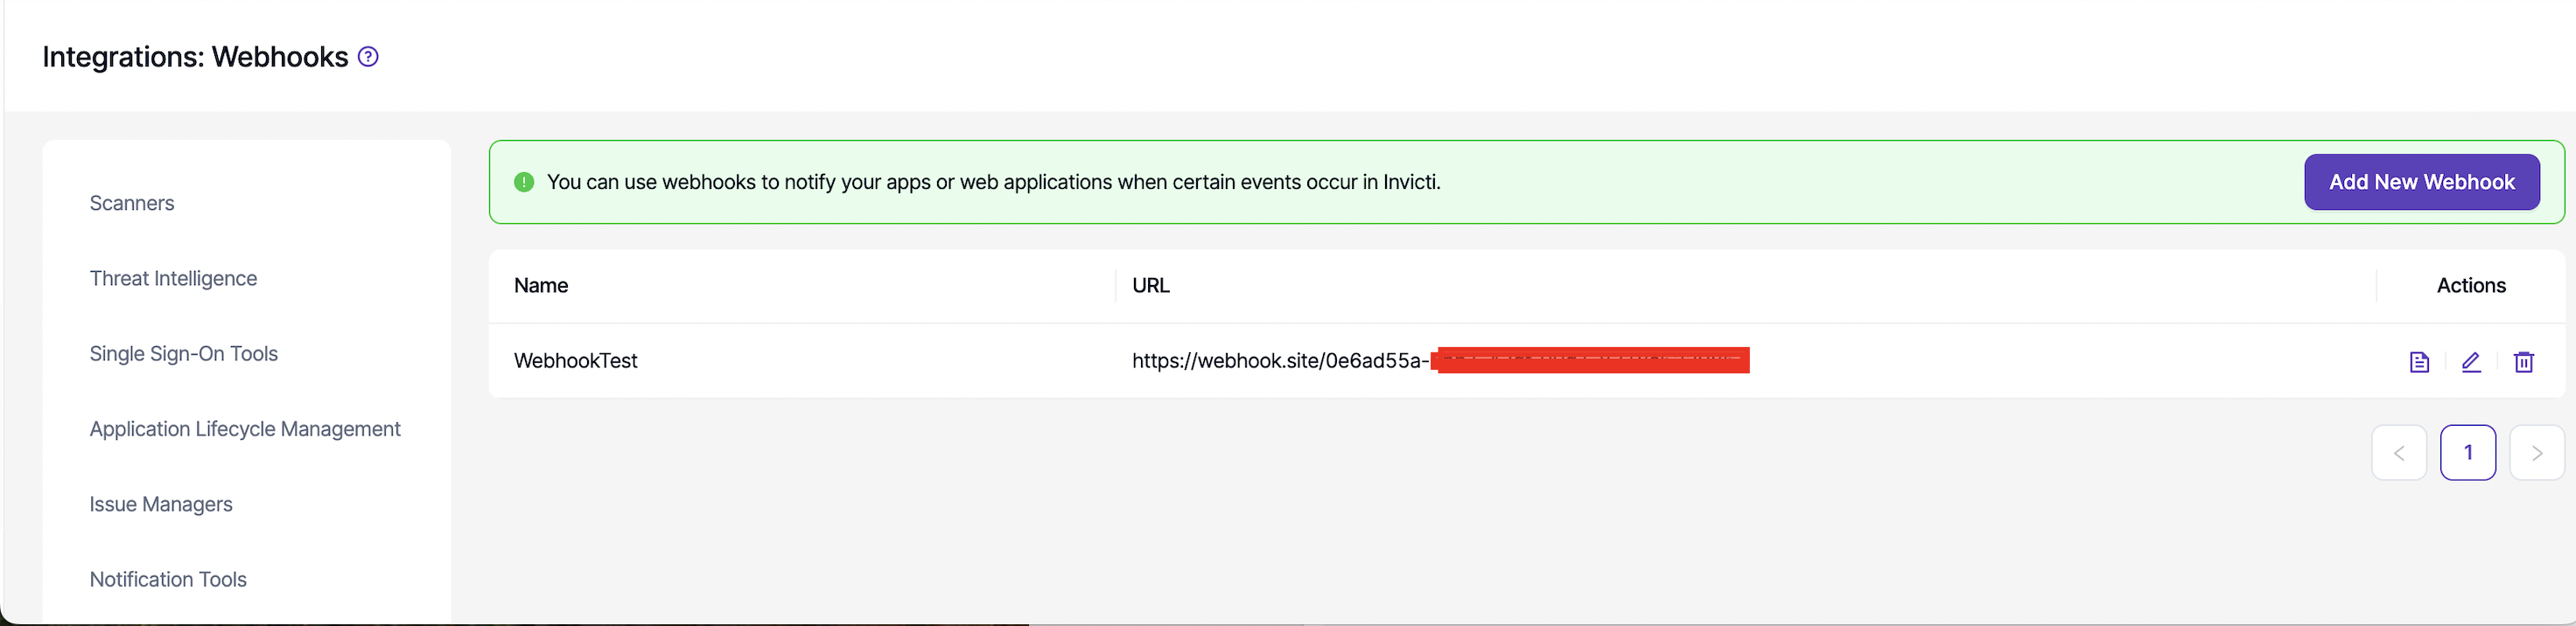
- Name: Webhook name (WebhookTest)
- URL: Webhook endpoint URL ( https://webhook.site/0e6ad55a-xxxx-xxx-xxxx-xxxxxxxxxxx )
- Actions: Operations you can perform on the webhook
- Copy
- Edit
- Delete
Step 5: Examine Webhook details - Initial State
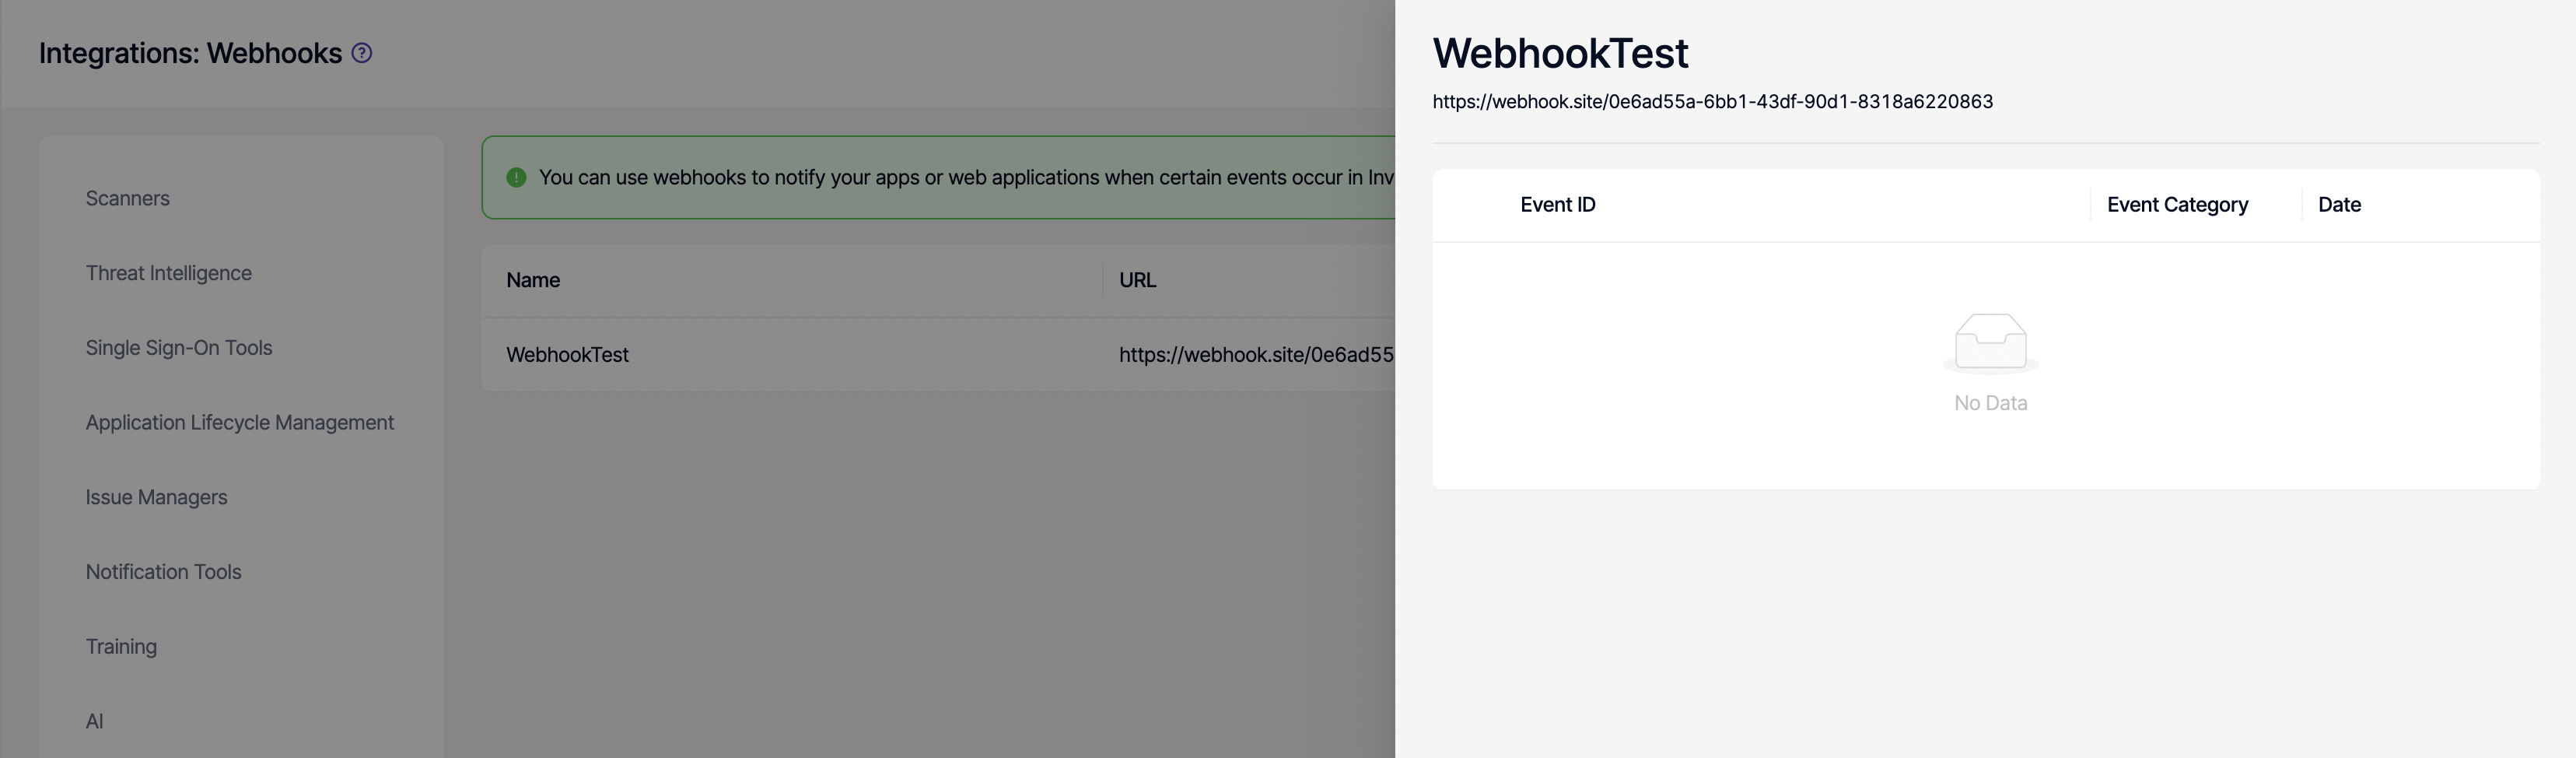
The webhook detail page initially shows:
- The webhook name and URL at the top
- A table listing events (Event ID, Event Category, Date columns)
- Initially, a "No Data" message appears because no events have been triggered yet
Step 6: Monitor webhook events
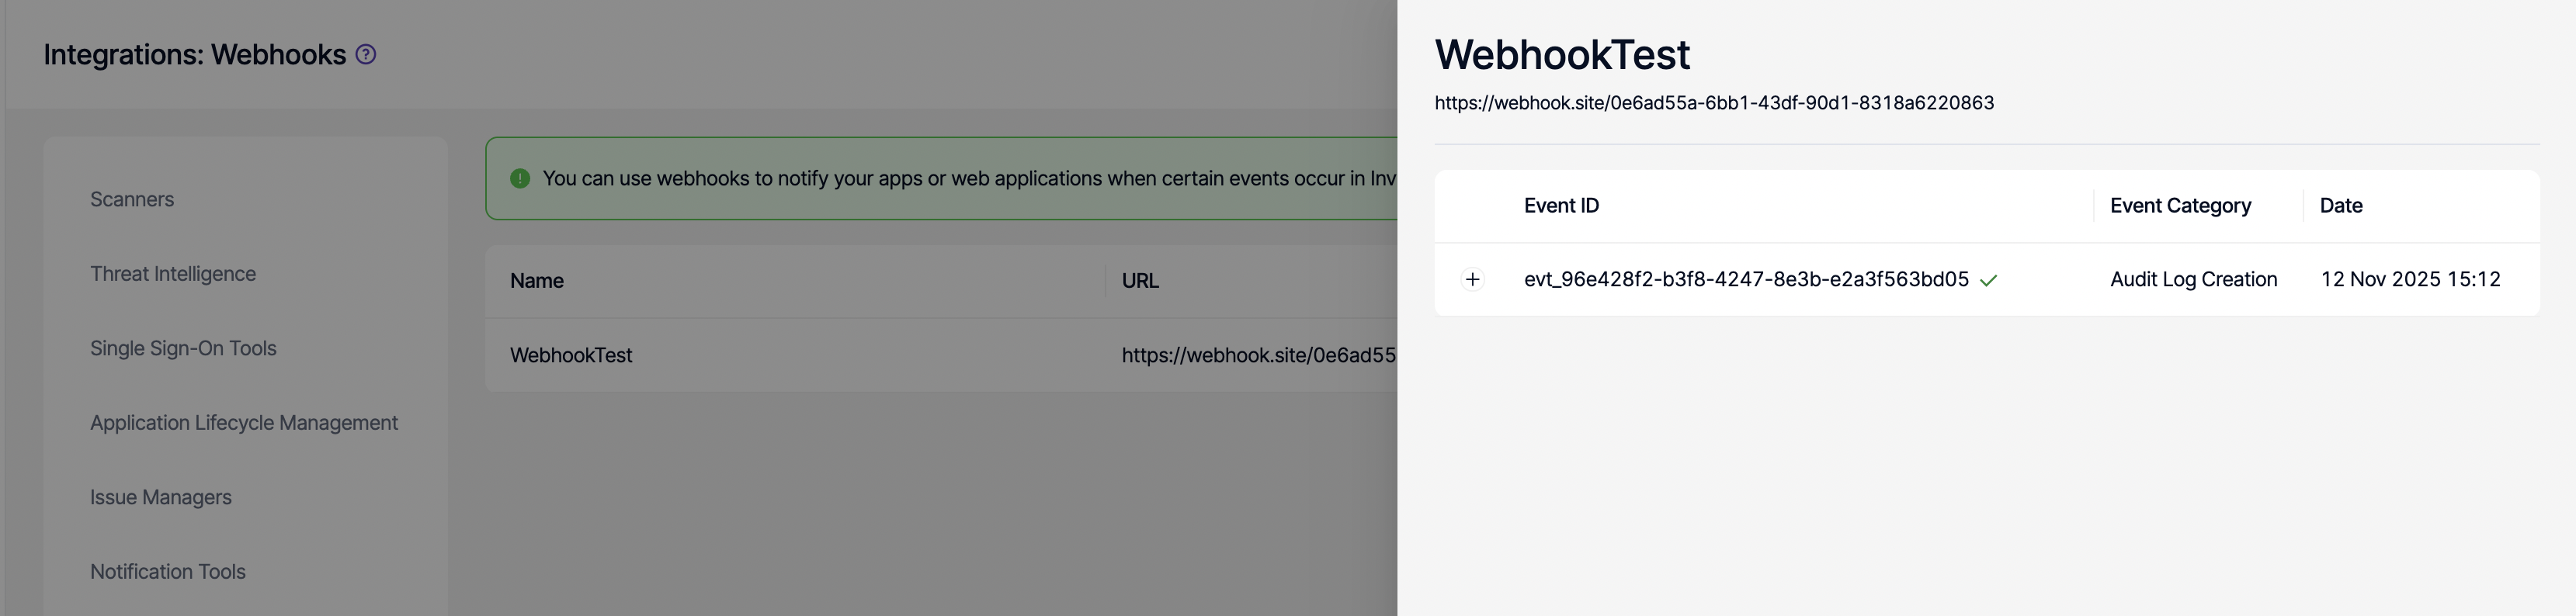
When events are triggered, the first webhook event appears in the list displaying:
- Event ID: evt_96e428f2-b3f8-4247-8e3b-e2a3f563bd05 (shown with a + sign at the beginning)
- Event Category: Audit Log Creation
- Date: 12 Nov 2025 15:12
- Successful events are shown with a green checkmark (✓)
Analyze webhook event details
Request tab
When you click an event, a detail page appears showing two tabs: Request and Response. The Request tab displays:
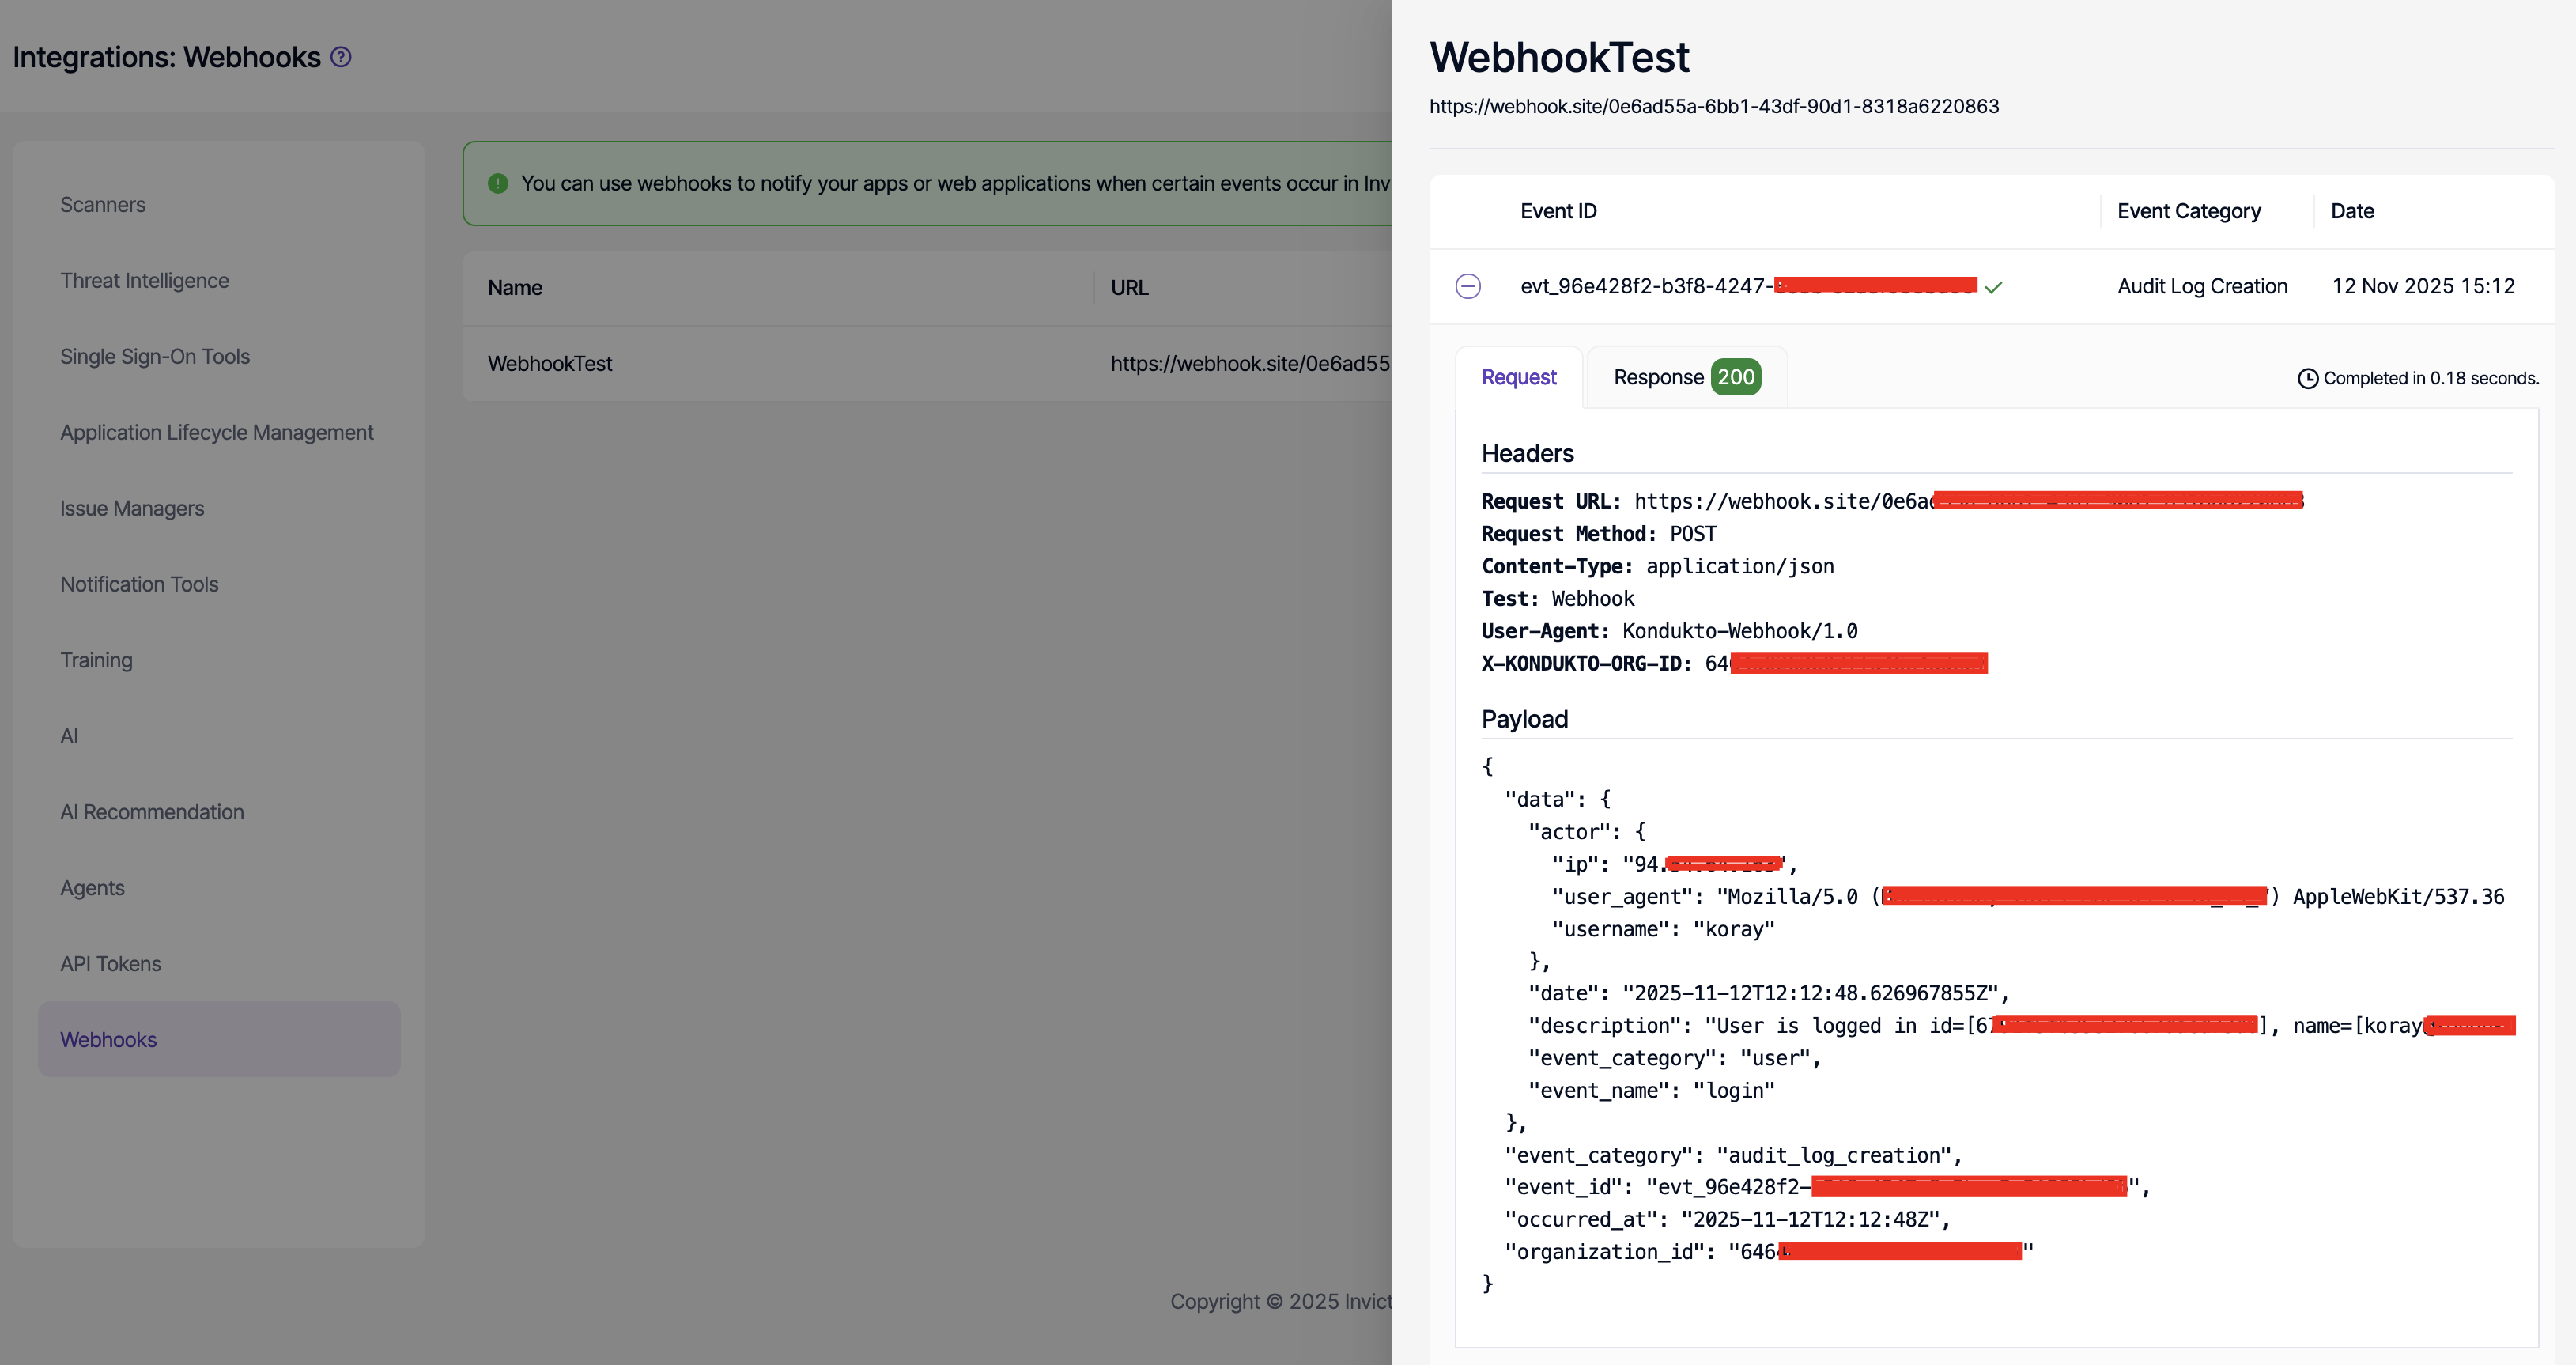
At the top of the page is an event summary, followed by two tabs:
- Request (currently selected tab)
- Response 200 (with successful response code)
Request Tab
The Headers section shows the HTTP headers sent:
Request URL: https://webhook.site/0e6ad...
Request Method: POST
Content-Type: application/json
Test: Webhook
User-Agent: Kondukto-Webhook/1.0
X-KONDUKTO-ORG-ID: 646...
The Payload section displays the JSON data sent:
{
  "data": {
    "actor": {
      "ip": "94.xxx.xxx.xxx",
      "user_agent": "Mozilla/5.0 (KHTML, like Gecko) Chrome/...",
      "username": "koray"
    },
    "date": "2025-11-12T12:12:48.626967855Z",
    "description": "User is logged in id=[67...], name=[koray...]",
    "event_category": "user",
    "event_name": "login"
  },
  "event_category": "audit_log_creation",
  "event_id": "evt_96e428f2-...",
  "occurred_at": "2025-11-12T12:48Z",
  "organization_id": "646..."
}
In the upper right corner, the message "Completed in 0.18 seconds" shows how long the request took to complete.
Response tab
The Response tab displays the information returned by your webhook endpoint:
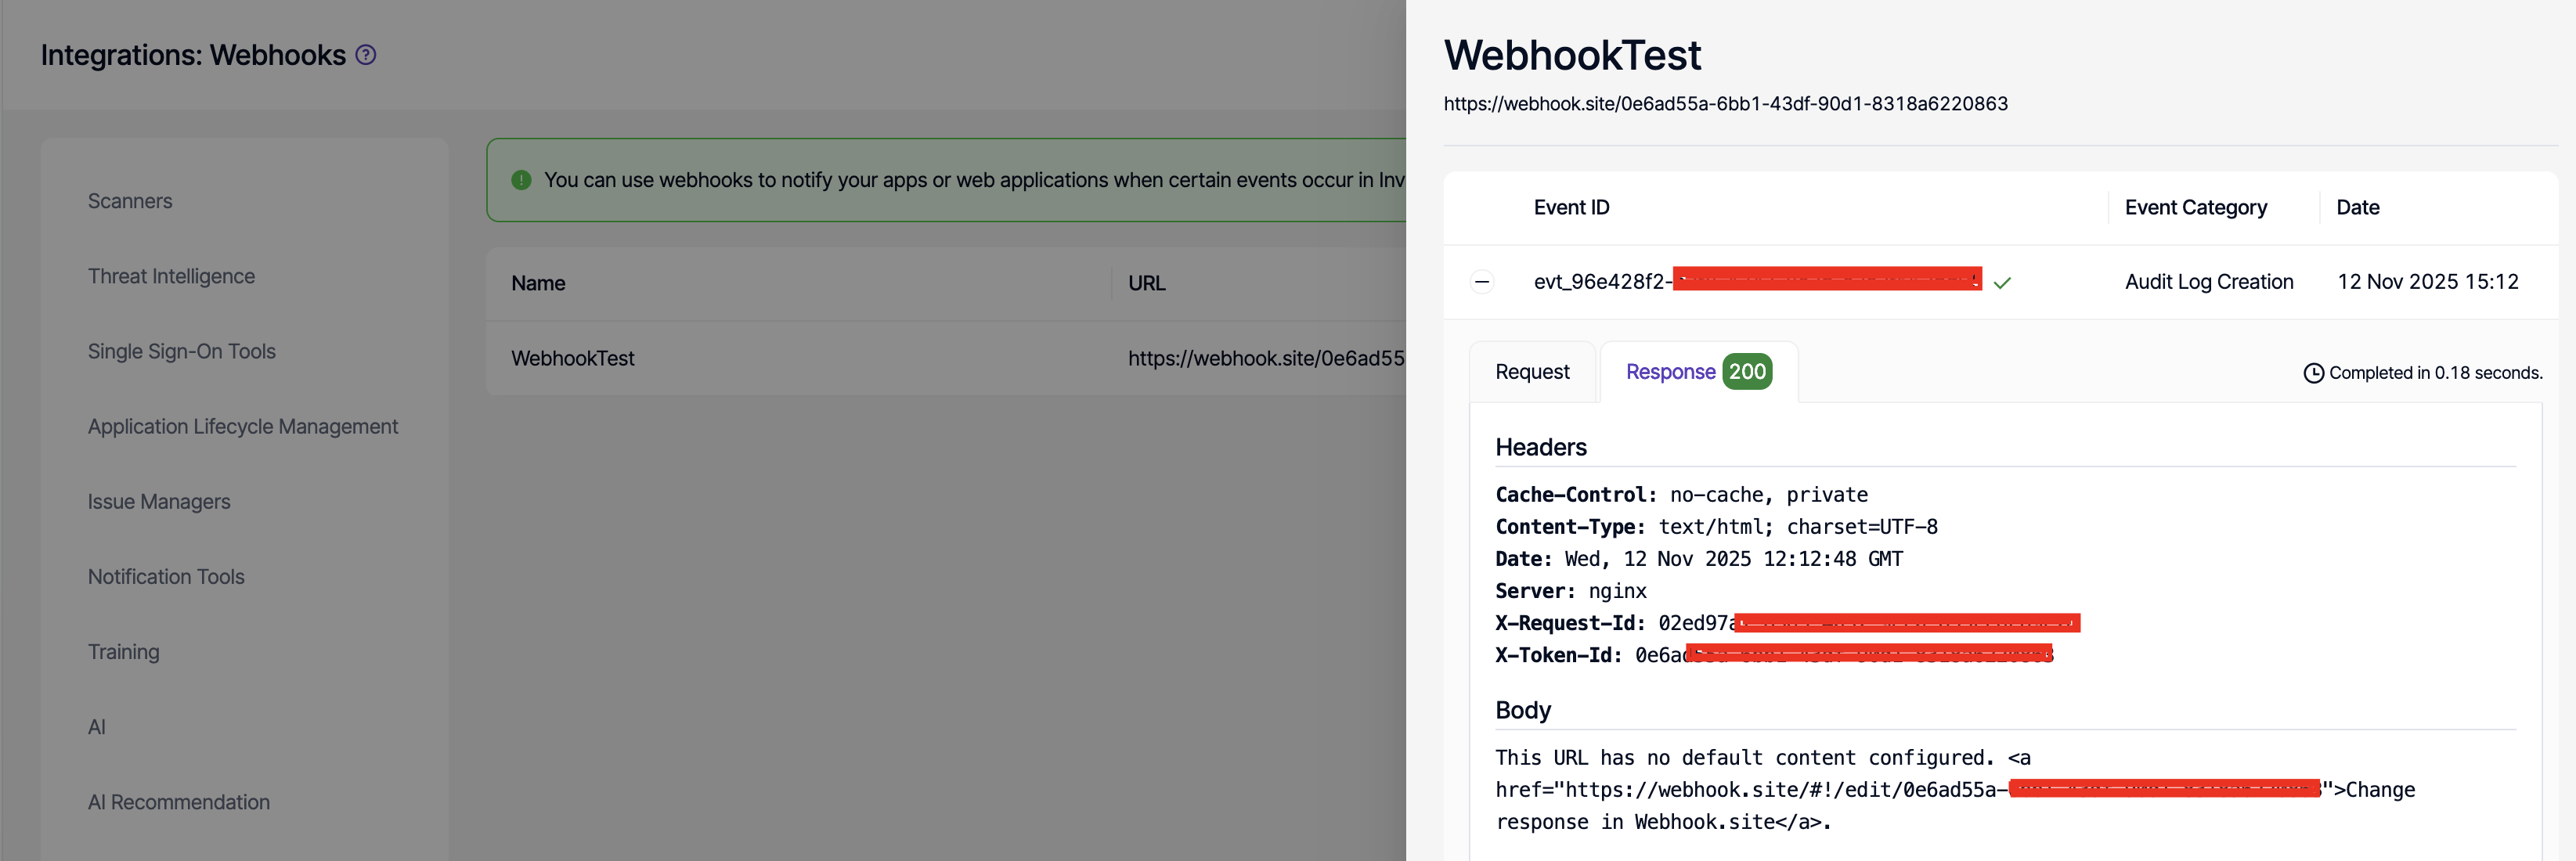
Response Headers
The Headers section shows response headers:
Cache-Control: no-cache, private
Content-Type: text/html; charset=UTF-8
Date: Wed, 12 Nov 2025 12:12:48 GMT
Server: nginx
X-Request-Id: 02ed97a...
X-Token-Id: 0e6a...
Response Body
The Body section displays the content returned by the webhook endpoint. In the image, you can see webhook.site's default message: "This URL has no default content configured. Change response in Webhook.site."
Test with webhook.site
When testing your webhook integration with webhook.site, you can examine the data in real-time:
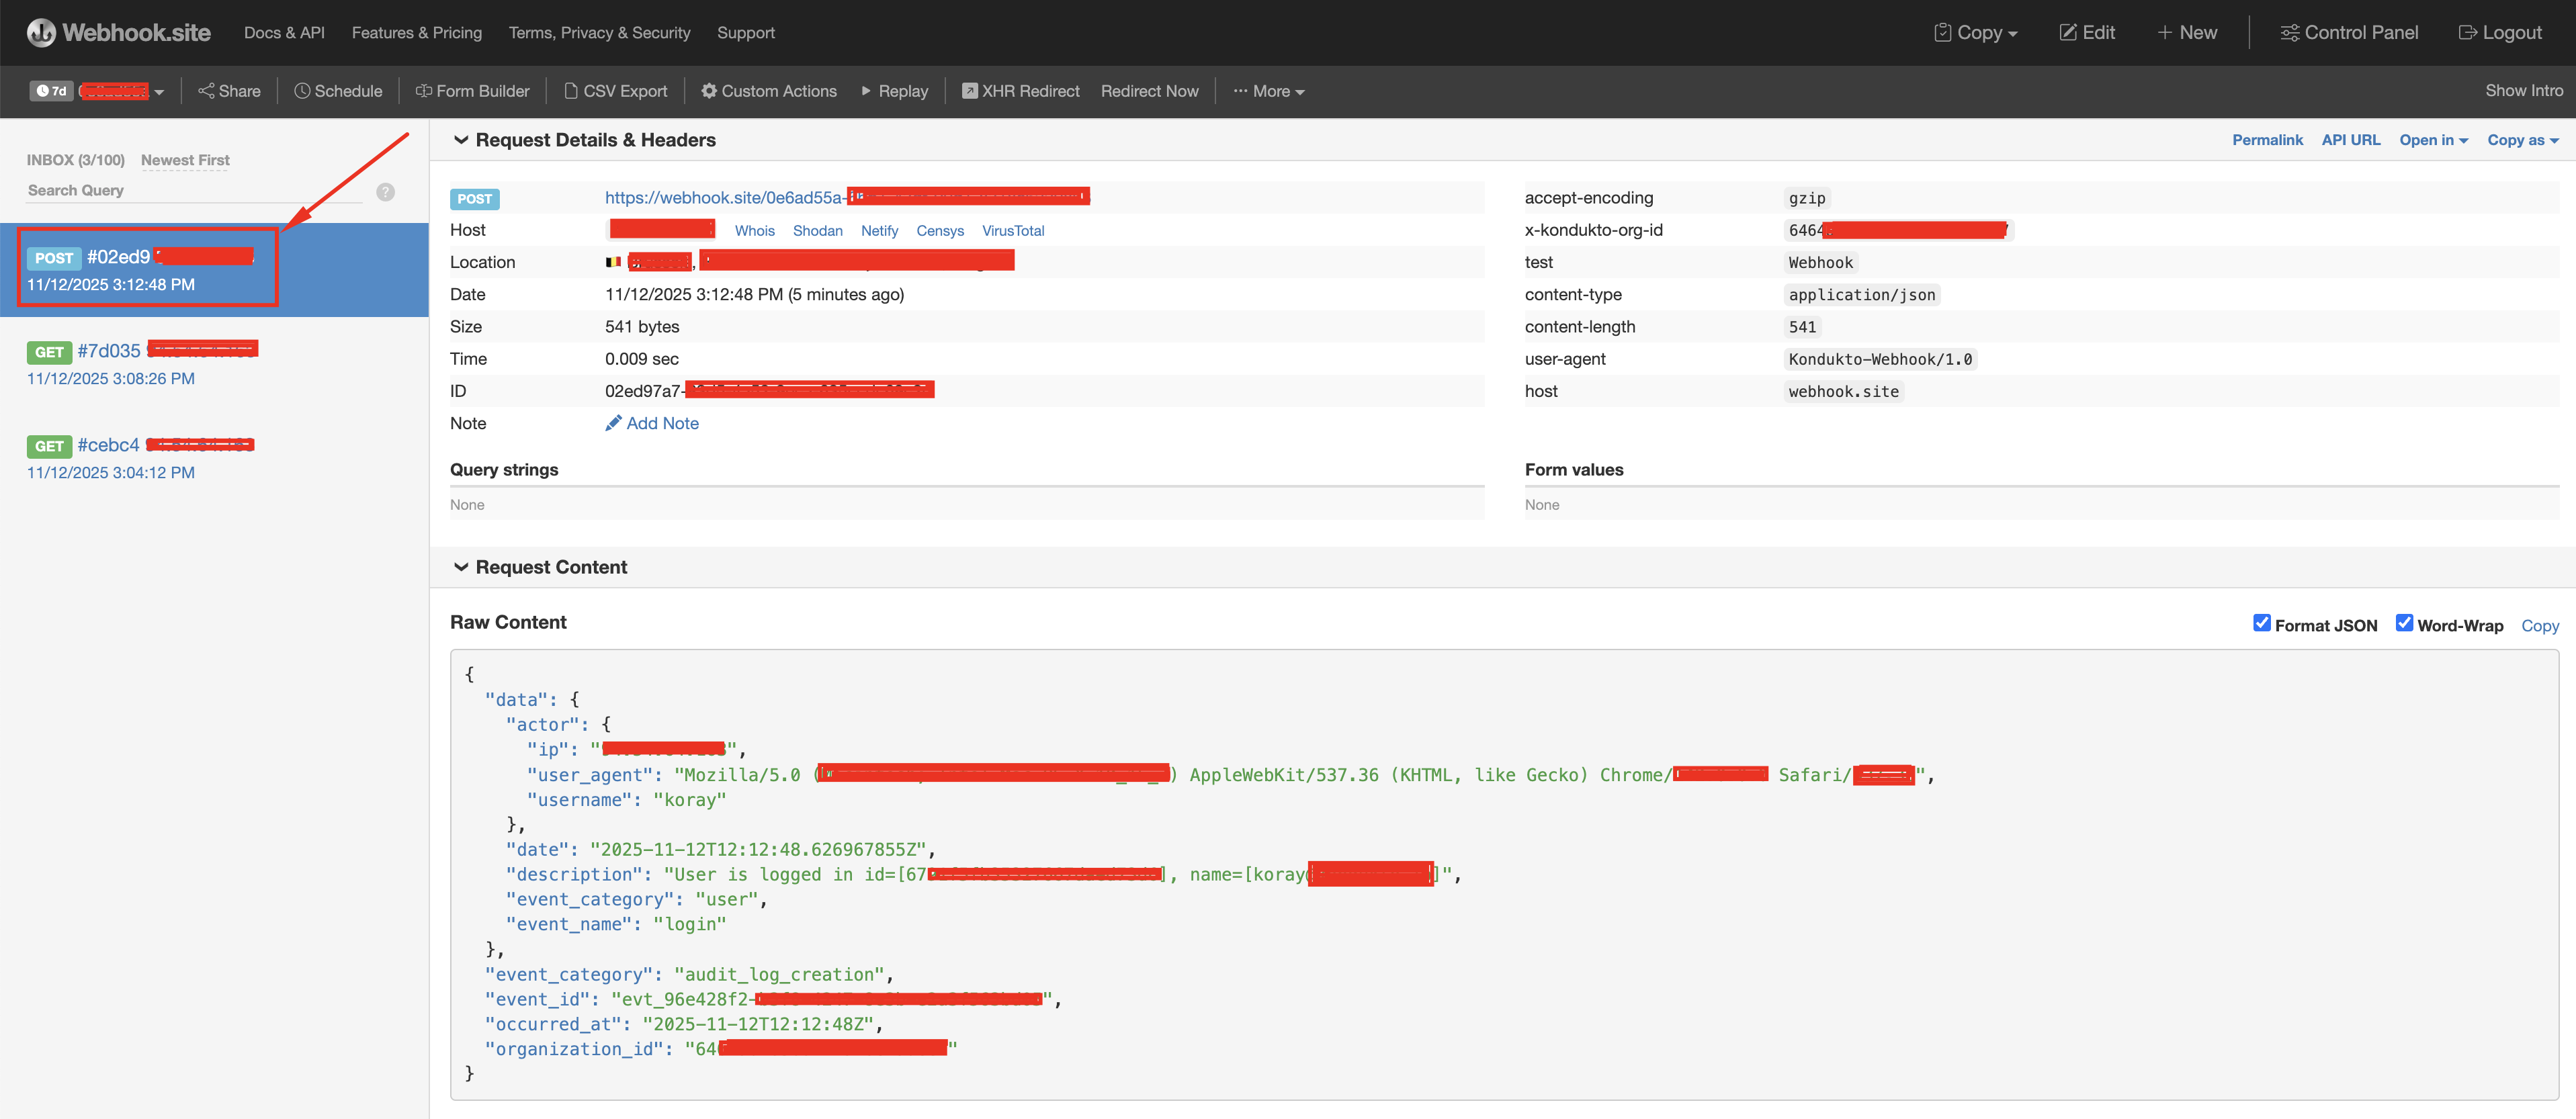
Left Panel (INBOX)
List of incoming requests:
- For each request, the HTTP method (POST, GET, etc.), request ID, and timestamp are displayed
- In the image, three different requests are listed (POST #02ed9..., GET #7d035..., GET #cebc4...)
- The selected POST request is highlighted with a red rectangle
Right Panel
Details of the selected request:
- Request Details & Headers tab is open
- Host, Location, Date, Size, Time, and ID information are liste
- Query strings and Form values sections (empty)
Additional information on the right:
- accept-encoding: gzip
- x-kondukto-org-id: 646...
- test: webhook
- content-type: application/json
- user-agent: Kondukto-Webhook/1.0
- host: webhook.site
Request Content Section
At the bottom of the screen:
- Format JSON and Word-Wrap options are checked
- Raw JSON data is displayed (same content as the payload sent by Kondukto)
This way, you can examine the data sent by Kondukto in real-time and verify that your webhook integration is working correctly.
Webhook Payload Structure
The webhook payload sent by Kondukto has the following main structure:
json
{
  "data": {
    "actor": {
      "ip": "IP address",
      "user_agent": "Browser information",
      "username": "Username"
    },
    "date": "ISO 8601 date format",
    "description": "Event description",
    "event_category": "Event category",
    "event_name": "Event name"
  },
  "event_category": "audit_log_creation",
  "event_id": "Unique event ID",
  "occurred_at": "Event time",
  "organization_id": "Organization ID"
}
Security Recommendations
Follow these recommendations to ensure secure webhook implementation:
- Use HTTPS: Your webhook URL must use the HTTPS protocol
- Header Validation: Use custom headers to validate incoming requests (as shown in Image 3)
- IP Restriction: If possible, only accept requests from Kondukto IP addresses
- Secure Mode: Enable "Secure" mode when creating the webhook (as shown in Images 2 and 3)
- Error Handling: Implement proper error handling in your webhook endpoint
Updated 4 months ago