Description of Cards
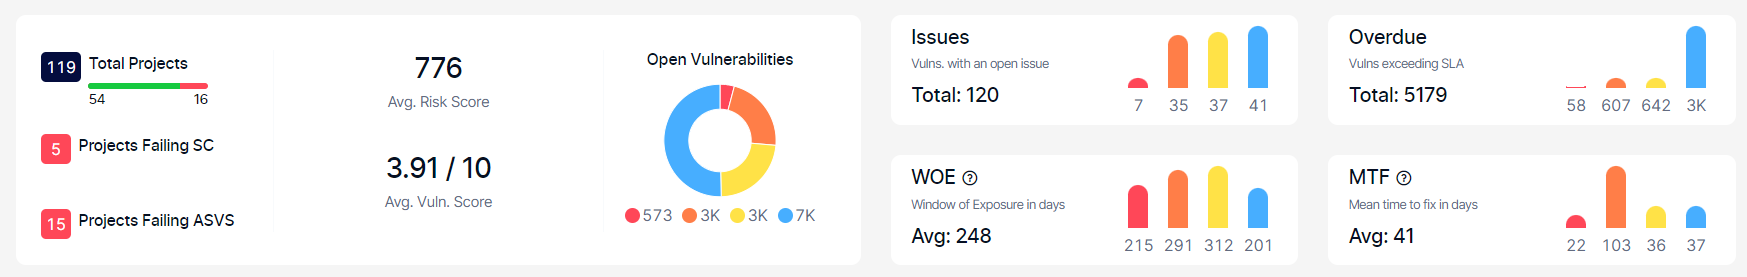
Total Projects: It shows the total number of projects on Kondukto. The bar below shows the number of projects with a risk score below and above the organizational average risk score (776 in the screenshot above). Projects with no vulnerabilities yet are not included in the calculation on the bar.
Projects FailingSC: It shows the total number of projects which do not meet their security criteria.
Projects FailingASVS: It shows the total number of projects which contain vulnerabilities that cause the project to be non-compliant with ASVS.
Average Risk Score: Calculated by the number of new and recurrent vulnerabilities shown in the Vulnerability Summary Table using the following scores assigned to each severity category by default.
An admin-level user can manually adjust these scores from Automation -> Setup -> Severity Score.
Critical: 10
High: 9
Medium: 4
Low: 2
Once a total risk score is calculated using the above scores, it's divided by the number of projects scanned to find the average risk score.
Average Vulnerability Score: Calculated by dividing the total risk score by the number of new and recurrent vulnerabilities.
Issues: Indicates the total number of new and recurrent vulnerabilities assigned to an issue on the issue manager and remains open, broken down by their severity categories.
Overdue: Overdue row displays the number of vulnerabilities that exceed their SLA.
WOE: Average time passed since discovering new and recurrent vulnerabilities. For vulnerabilities rediscovered after being closed, the first seen date is changed to when the vulnerability is rediscovered. WOE is calculated as the days between the current date and the first seen date.
MTTR: Average time it takes to fix the closed vulnerabilities. For vulnerabilities rediscovered after being closed, WOE is calculated instead of MTTR.